PANORAMA
Evidence for a young solar system from KBO pairs
A handful of moons orbiting icy space
rocks on the fringes of the solar system and discovered over the past couple of
years have astronomers puzzling over their presence and size. Add to that the recent discovery of what
some have heralded as the tenth planet, tentatively named Sedna, and the
mystery deepens.
 ______________________
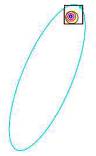
At left: Sedna’s orbit compared with the other planets out to Pluto. Its eccentricity is that of a comet, not a
planet. If astronomers challenge
Pluto’s status as planet because of its elliptical orbit (largest circle in the
square box), certainly the case against Sedna as planet is far stronger. Sedna’s discovery position is represented by
the dot in the upper right corner of the square box.
The Kuiper Belt region of the solar
system stretches from just past Neptune to beyond the farthest reaches of
Pluto’s orbit. To date, more than 500
Kuiper Belt Objects (KBOs) have been found since 1992. About two years ago, the first satellite
orbiting a KBO was discovered.
Astronomers were surprised to discover that in many cases, the satellites
are as large or nearly as large as the KBOs they orbit.
Evolutionists think satellites were
formed by collisions. In a paper to be
published in the October issue of The Astronomical Journal, author Stern
questions the evolutionary model for how such large KBO-satellite pairs could
form. The collision model for large
satellite formation assumes that two large objects form a bond when two bodies
pass by each other. If their relative
speed is low enough, the model can explain binary systems around asteroids, as
well as Pluto and its moon Charon.
Today this is the leading evolutionary explanation for the
formation of the earth-moon system.
(The model fails dismally to explain binary and multiple stars. About 2/3 of all stars are members of
multiple systems.) Now, collisions of
the magnitude required to form KBO satellites, Stern found to be energetically
improbable, given the number and masses of potential impactors in the Kuiper
Belts. Stern concludes that either the
surface of the KBOs with satellites, or the surfaces of the satellites themselves
are much shinier than observed for comets and asteroids. Of course, it may also be that the solar system
is a lot younger than commonly assumed or formed by a totally different process
than accepted theory allows.
The Great Wall of galaxies revisited
About twelve years ago, we published
an article by David and Linda Harris in which they related that the
distribution of galaxies about the earth seemed to fall on a great wall
centered on the earth.[1] The Great Galactic Wall, as it was called at
the time, presented evidence from a 1989 paper by Margaret J. Geller and John
P. Huchra of the Harvard-Smithsonian Center for Astrophysics who first reported
the wall as a structure much larger than the Virgo Cluster of Galaxies. Although that research was based on several
thousand galaxies, new research results obtained from the Sloan Digital Sky
survey (SDSS), led by Max Tegmark of the University of Pennsylvania, has now
mapped over 200,000 galaxies. More than
200 astronomers from 13 institutions are involved in the data reduction.
The following comments are quoted from
William Corliss.[2]
 The accompanying figure is a
two-dimensional wedge-shaped slice of this cosmic map. It pinpoints approximately 33,500 galaxies.
The accompanying figure is a
two-dimensional wedge-shaped slice of this cosmic map. It pinpoints approximately 33,500 galaxies.
The roughly concentric distribution of
galaxies about the point of the wedge, which is the earth, is inescapable. Also readily apparent is a decrease in
galaxy density with increasing distance from the earth.
The implications of the SDSS work so
far is highly unsettling to [evolutionists] for two reasons:
1.
The Cosmological Principle, which demands that the
universe be homogeneous with no favored center, is violated.
2.
The earth does seem to be at center of the
observable universe contrary to the adamant philosophical declaration of
science that the earth and its cargo are insignificant in the Grand Scheme of
Things—whatever that is!
Corliss continues, and correctly notes
that: “The accompanying SDSS map is consistent with the long-claimed [Since
mid-1960s—Ed.] quantization of redshifts. (SF#105)
“It is possible that astronomers
misinterpret redshifts as yardsticks thereby invalidating the SDSS maps.
“No one yet knows whether the earth
might also be at the center of the distributions of dark matter and dark
energy—assuming they exist and are not uniformly dispersed.”
To this, your editor would like to add
that the quantized redshifts would indeed give an earth-centered view as one
sees in the map, but if one were to move away from the center then the
72-km/sec quantized rings seen in the map would disappear. This is strong evidence for the Scriptural
doctrine of geocentricity, that the earth is in a special place, albeit the
shells—for the concentrations are in shells akin to Varshi’s discovery of
shells of quasars about the earth—do not provide evidence for a stationary
(geostatic) earth.
Notice that there are at least five
concentric shells about the earth.
Galaxy luminosity distribution finds evidence for
geocentricity
A paper printed in the 29 June 2004
issue of the Monthly Notices of the Royal Astronomical Society[3]
claims that when galaxies are grouped into bins according to luminosity
(intrinsic brightness, that is, how bright each galaxy would appear if it were
moved to a specific distance from earth), a roller-coaster-like normal
distribution describes galaxies of mid-to-lower luminosity while an exponential
curve describes the distribution of galaxies of greater luminosity.
Evolutionarily speaking the question
is why, if the universe were 13.6 billion years old, would it spawn humps of
medium-luminosity galaxies that peaked a short time ago and then dwindled away
completely? These form shells about the
earth just as certainly as the SDSS maps.
Indeed, the current evidence is also based on SDSS data.
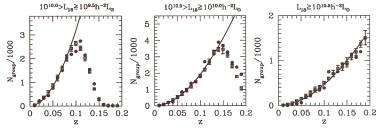
In the figure below, the numbers on
the vertical axis, (Ngroup/1000) is the number of galaxies in that
bin in thousands, and the axis labeled z is the redshift in the usual
notation. The solid line is the curve
that plots the expected value. The
reader will readily see that for the lowest luminosity galaxies (leftmost
curve), and for the mid-luminosity galaxies (center curve), the points drop
well below the expected value while the high-luminosity galaxies, at right,
follow the expected distribution curve.
The leftmost two curves are of such a nature that they would lose their
central focus if observed from another place significantly offset from the
earth.
An explanation for this that is
acceptable to evolutionists is that if each galaxy had an intrinsic redshift
(one that is not due to Doppler shift), and at the same time the attenuation
(stretching) of space is greater than predicted by the theory of relativity,
then the nearby, fainter galaxies are slightly displaced, but as the error
introduced by the intrinsic red shift becomes a successively smaller and
smaller percentage compared to the total red shift, that the data would peak
and then would drop to insignificance.
 In the above hypothesis, the
stretching effect is underestimated, and this fainter population of galaxies
then appears to dwindle with increasing distance. Astronomers note that the red galaxy population (presumed to be
old) dies out at a certain distance, but stronger telescopes keep stretching
that distance further and further out.
This effect in galaxy populations is consistent with the
lower-than-predicted magnitude of distant supernovae, which would then be
wrongly attributed to an increase in the expansion rate of the universe due to
“dark energy.”
In the above hypothesis, the
stretching effect is underestimated, and this fainter population of galaxies
then appears to dwindle with increasing distance. Astronomers note that the red galaxy population (presumed to be
old) dies out at a certain distance, but stronger telescopes keep stretching
that distance further and further out.
This effect in galaxy populations is consistent with the
lower-than-predicted magnitude of distant supernovae, which would then be
wrongly attributed to an increase in the expansion rate of the universe due to
“dark energy.”
We could also postulate changes in the
local speed of light as a function of distance from the earth as an explanation,
changes which may possibly affect the force or strain of gravity, which in turn
effects the age-dependent models used to determine the properties of a star, in
particular its evolutionary “age.”
Regardless of the explanation, this phenomenon is geocentric in nature
and attests to the special location and significance of the earth as related in
the scriptures. No scientific fact
has ever contradicted Scripture once the fact was understood completely in context.
The ossuary of James may not be a hoax after all[4]
In October 2002, the Biblical
Archaeology Review (BAR)reported the find of an ossuary, a box built to
preserve the bones of a prominent person after the body has decomposed, with
the inscription, “James the son of Joseph, the brother of Jesus.” On June 18, 2003, a committee appointed by
the Israel Antiquities Authority (IAA) declared the inscription to be a
forgery. This was the basis for an
earlier Panorama piece.[5]
Since then, other experts and research
institutions have examined the box and each has concluded that the ossuary
inscription is authentic. Among those
are P. Kyle McCarter, Albright Professor at the Johns Hopkins University,
Israeli paleographer Ada Yardeni, and one of the world’s leading Aramaic
experts, Joseph Fitzmyer of the Catholic University of America, who, after some
initial hesitation, judged the somewhat peculiar Aramaic phrasing on the
inscription to be appropriate to A.D. the first century. The Geological Survey of Israel, a
government agency, also examined the box and its inscription at BAR’s request
and found both to be authentic. A team
from the Royal Ontario Museum in Toronto, where the ossuary had been on
exhibit, also judged it authentic.
It turns out that the pronouncement that the inscription is a forgery primarily stemmed from one man, Professor Yuval Goren of Tel Aviv University. The decision of the IAA purports to be by unanimous agreement of a 15-person committee, each of whom had been named by the IAA. It appears, however, that the only one on the committee with any geological and chemical knowledge on which the conclusion is based is Yuval Goren. He managed to convince the rest of the five-person sub-committee of his scientific conclusions based on materials in which they were not expert and which they have no more than a laypersons’ knowledge. This sub-committee convinced the other scholars of the conclusion of the five-person scientific committee. The committee of other scholars had even less scientific expertise. Of course, Professor Goren may still be right, but we need to wait for further developments before arriving at this conclusion. Beyond that, it will be impossible to prove that the Jesus and James mentioned in the inscription are the Christ and his brother.
Antarctic lake water will fizz
like a soda[6]
Water released from Lake Vostok, deep beneath the south polar ice sheet, could gush like a popped can of soda if not contained, opening the lake to possible contamination and posing a potential health hazard to NASA and university researchers. A team of scientists that recently investigated the levels of dissolved gases in the remote Antarctic lake found the concentrations of gas in the lake water were much higher than expected, measuring 2.65 quarts (2.5 liters) of nitrogen and oxygen per 2.2 pounds (1 kilogram) of water. According to scientists, this high ratio of gases trapped under the ice will cause a gas-driven “fizz” when the water is released. Lake Vostok lies under 2.5 miles (4 km) of ice. Evolutionists believe it to contain microorganisms living in an environment that may be analogous to Jupiter’s moon, Europa, which apparently contains oceans trapped under a thick layer of ice.
An important implication of this finding is that if scientists expect to find life in water with oxygen levels fifty times higher than that found in ordinary freshwater lakes on earth, that life has to have special abilities, such as high concentrations of protective enzymes, in order to survive. To find out, an international group of researchers that will deploy a remote observatory at Lake Vostok within three years and return samples within ten years.
The team also discovered that the air-gas mixture there, besides dissolving in the water, also is trapped in a type of structure called a clathrate. In clathrate structures, gases are enclosed in an icy cage and look like packed snow. These structures form at the high-pressure depths of Lake Vostok and would be unstable if brought to the surface.
Lake Vostok is one more than 70 such lakes deep beneath the polar plateau. They are part of a large, sub-glacial environment that has been isolated from the atmosphere since Antarctica became covered with ice about 4,000 years ago. Evolutionists believe that the ice sheet formed more than 15 million years ago. The new finding presents a problem for that age. Ice is porous, and under such pressure the gasses should escape to the surface over time or, at least, into the surrounding ice. This is the same type of problem encountered with oil fields. If they are more than 10,000 years old, then all pressure would be gone and one would not find any gushers.
[1] Harris, D., & L. Harris,
1992. “The Largest Structures in the
Universe,” Biblical Astronomer, 2(61):4-15.
[2] Corliss, W., 2004. “Could we really be at the center of the
universe?” Science Frontiers,
no. 154, pp. 1-2.
[3] Yang, X., H.J. Mo, F. C. van
den Bosch, & Y.P. Ying, “The Two-Point Correlation of galaxy Groups:
Probing the Clustering of Dark Matter Haloes,” preprint at
arXiv:astro-ph/0406593 v1 25 Jun 2004.
[4] Shanks, Hershel,
http://www.belief.net/story/128/story128521.html.
[5] Panorama, 2003. “James Ossuary a hoax,” B.A., 13(105):100.